
Estimating the Number of Automated License Plate Readers in California
One of the most basic questions about automated license plate readers (ALPRs) turns out to be surprisingly difficult to answer: how many of them actually exist?
When I first began investigating ALPR deployments in the 2010s, the best estimates suggested there were only a few thousand readers nationwide. At the time, that was probably reasonable. Only a limited number of law enforcement agencies had adopted the technology, and the systems were expensive. Early ALPR hardware often cost upwards of $30,000 per camera.
In the late 2010s, it was already apparent that the technology was being quickly adopted nationwide. The economics of the technology changed dramatically. Hardware costs declined, adoption spread rapidly, and new companies, most notably Flock Safety's market entry with subscription-based systems, made large-scale deployments far more feasible for local governments. Agencies that might have had sticker shock in the past could suddenly install dozens of ALPRs.
Despite this expansion, there is no master database of ALPR deployments and some vendors have explicitly declined to confirm the number of cameras they have deployed. By far, the best available resource is the Atlas of Surveillance, a project of the Electronic Frontier Foundation, which aggregates public reporting on law enforcement technologies across the United States. The Atlas, which provides documentation in the form of government records and news coverage from established outlets, currently identifies more than 300 California agencies that use ALPR systems and documents 5,112 ALPRs.
However, the dataset has a limitation, of no fault of its makers, while some entries list exact camera counts, roughly 180 agencies do not list the number of readers they operate. In theory, the missing numbers might be obtained through public records requests sent to every agency. Many cities contracting with Flock have transparency portals that list the number of cameras, though most of these are already included in the dataset. Someone could look through a bunch of old city records spanning years for each of the missing agencies. In practice, any of those approaches would require significant time and resources. The only practical solution is statistical inference.
I exported all the ALPR entries from the Atlas of Surveillance, excluding pan-tilt-zoom cameras (PZTs) and other systems that appear in this subsect of the Atlas, unless they explicitly incorporated optical character recognition for license plates. Some PZTs can observe vehicles via object recognition but might not automatically capture and process license plate data.
After organizing the California data, it was clear that the number of ALPRs a city has varies widely. Very broadly speaking, larger metros have more cameras. That is not much of a surprise, but a difficulty is that a metropolitan area is not the same thing as a jurisdiction or an agency and so treating various entries uniformly could obscure differences and yield unrealistic estimates.
Stratified Median Approach
The first approach attempted to account for variation across jurisdictions by grouping cities by population.
I divided the cities into five population bins, each containing roughly 65 agencies. Within each bin, I calculated the median number of ALPRs per 10,000 residents, using only agencies with confirmed camera counts.
The median ratio from each bin was then applied to the populations of agencies where camera counts were unknown. Because these calculations often produced fractional results, values were rounded to the nearest whole number. When a confirmed count was available, the estimated value was replaced with the actual figure.
This method helps address one of the most striking patterns in the dataset: what might be called the “superuser” phenomenon. In some small jurisdictions, which are often affluent suburbs, the number of ALPRs per resident is extraordinarily high. Atherton, California, for example, operates dozens of cameras despite its relatively small population. Several other small cities display similar patterns. These superusers can dramatically distort statistical measures of the middle. If the mean number of cameras per capita were used, a handful of outliers would inflate estimates across the entire dataset. The median, by contrast, dampens the influence of these extremes and provides a more stable baseline.
To make this concept more precise, I propose defining a superuser jurisdiction as one in the 90th percentile of ALPRs per capita. In the current dataset, that threshold is roughly 18 readers per 10,000 residents. Using this definition (and excluding sheriff’s departments, which are reported differently), eight California jurisdictions qualify as superusers: Atherton, Carmel, Clearlake, Colma, Hillsborough, La Cañada, Piedmont, and Vacaville.
To test the reliability of the stratified median method, I backtested it against jurisdictions with known camera counts. In the smallest population bin, the model predicted 275 cameras, while 383 cameras actually exist. This discrepancy highlights how heavily small-city outliers can affect estimates.
Because the smallest bin showed the largest deviation, I incorporated an error term to produce a range rather than a single figure.
Accuracy improved in larger population bins. For example, in the second bin (cities with roughly 18,700 to 39,400 residents), the model predicted 640 readers, compared with 646 confirmed readers, yielding an error rate of only 0.93%.
Using these error rates, statewide estimates were calculated as:
High estimate: (Error + 1) (Total Adjusted Estimate)
Low estimate: (1 − Error) (Total Adjusted Estimate)
An additional adjustment was necessary for areas like San Diego County, where multiple agencies (San Diego Police, the Sheriff’s Department, San Diego State University Police, and UC San Diego Transportation Services) are listed in the Atlas. Because their counts were reported in a manner that risked double-counting because they both use San Diego as the location identifier, I consolidated them into a single entry. This method produced an estimated statewide range of: 9,337–14,935 ALPRs.
Polynomial Regression
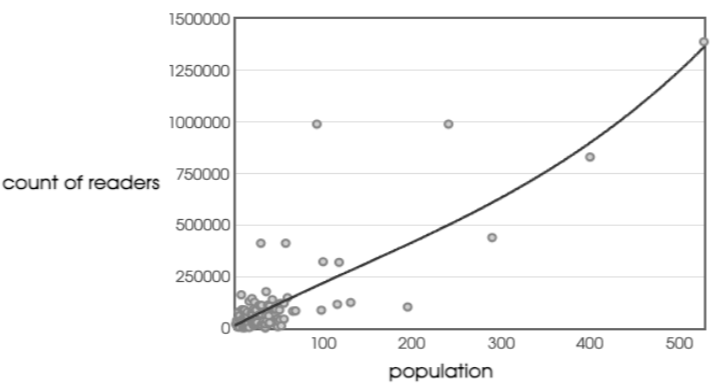
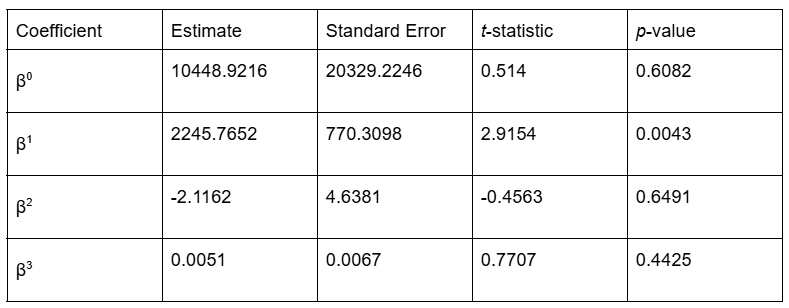
I tried a second strategy to see whether a regression model could better capture the relationship between population and camera counts. I tested samples using polynomial regression with the Known Count of Readers as the dependent variable and Population as the explanatory variable, making Population^2 and Population^3 as the other βs.
The results were not quite what I expected; it turned out that this completely overfitted the data. Perhaps I should have anticipated that, but it seemed reasonable to test whether the number of ALPRs grew or suddenly leveled off at larger populations. The R^2 value was approximately 0.6797. This indicates reasonably high levels of correlation, but the p-values for the various coefficients are very high, except for β^1, which is the only one that shows statistical significance.
Linear Regression
Given this, I completely scrapped the polynomial regression and just used a basic linear regression because β^1 is the clear standout coefficient. Instead, we’re just going to look at population and counts of readers. We retain the R^2 of about 0.67, which implies that the extra curves in the polynomial model were basically worthless. The F-statistic was 242, with a p-value of <0.0001, indicating strong statistical significance.
The equation of the line is:
Y = 0.0002902(Population) + 12.50.
To fill the gaps with cities of known population and unknown reader count, I multiplied the population by the linear regression slope and added the Y-intercept of 12.5. The standard error of the estimate (Sy.x) was 39.87, which was used to construct upper and lower bounds for each prediction. Because our list of cities only includes cities that have ALPRs, it is implausible for the cities to have less than 1 reader and so the lower bound is clamped at 1 in instances where the lower bound would result in a number that was illogically low (you can’t have a negative number of ALPRs). I rounded each estimate to the nearest whole number.
Adding the 5,112 readers documented in the dataset, the regression model produced a statewide range of 8,178–20,717 readers.
Best Current Guess
The middle of the regression-based range is notably higher than the stratified median. Using the two statistical approaches, it is reasonable to estimate a minimum of approximately 9,000 ALPRs statewide. The more conservative stratified method suggests an upper bound of ~15,000, while a linear regression suggests the count could potentially reach as high as 20,000. While both methods are predicated on a significant correlation between population and reader counts, they yield different predictive ranges for the unknown agencies. Linear regression might be sensitive to specific jurisdictions with exceptionally high reader counts relative to their population. These "superusers" may disproportionately pull the regression slope upward, leading to an upper-bound estimate that may overstate the equipment counts for average-sized agencies. For now, the stratified median offers a more defensible and realistic statewide estimate of 9,337–14,935 ALPRs.
Future Improvements
Future estimates would likely improve by including more variables, particularly more specific ones. A city's population may be a proxy for things like a city’s police budget, crime rate, or wealth, but those variables are not the same. Adding more explanatory variables to a multivariate analysis would likely yield a more precise answer.